Versión en Español: aquí.
What is a Value Network Analysis?
It is a map that analyzes the value network of an organization in its ecosystem, allows us to analyze the exchanges from an organic, dynamic and systemic perspective. Unlike the linear graphs of business processes, which seek to trace paths to walk efficiently and that are susceptible to continuous improvement, this map attempts to represent a vast territory to explore with an open mind and discover new possibilities.
Linear graphics are still useful and practical but have their conditioning blind spots. Already in the 1967 Conway Act, software programmer Melvin Conway explains: “Organizations that design systems are limited to producing designs that are copies of the communication structures of these organizations. Or put another way: “Any piece of software reflects the organizational structure that produced it.” In other words, if we want our organizations’ software to be more effective and to help our organization make a qualitative leap in the digital age, we first need to change the way we conceive and improve organizational dynamics.
The Value Network Analysis is a way to bring out much more information, including the structures of communication, exchange, and INTANGIBLE deliverables. The intangibles are the great forgotten in the traditional processes. They remain hidden for the workers who are in charge of advancing the product line, and they are told that they only have to do certain specific activities for everything to work, while the manager has a view from the heights, where he moves political processes such as the exchange of favors and strategic agreements. However, in the digital era, we discover that we are intellectual and emotional workers, that we notice that processes get stuck or slowed down, that we intervene with our emotions, that we get angry or frustrated when we don’t know how to make some things happen or how just to achieve the right rhythm. This map helps to get out of not talking and not seeing certain aspects that were previously only in the hands of managers; that is, it allows us to explore what is happening to us and open the door to the creative potential of teams.
What are the elements of a Value Network Analysis?
Verna Allee defines a value network as a set of roles and interactions that generates a concrete result (in the form of business, economic goods and/or social goods), through the exchange of value in the way of tangible or intangible deliverables. The beauty of this definition is that it presents the elements we need to build our value map: roles, transactions, and deliverables. We can map the value network from the perspective of the entire organization, an area of it, or a particular product/service/activity. For the reasons explained in the previous section, it is preferable to always speak in terms of activity rather than in terms of process.
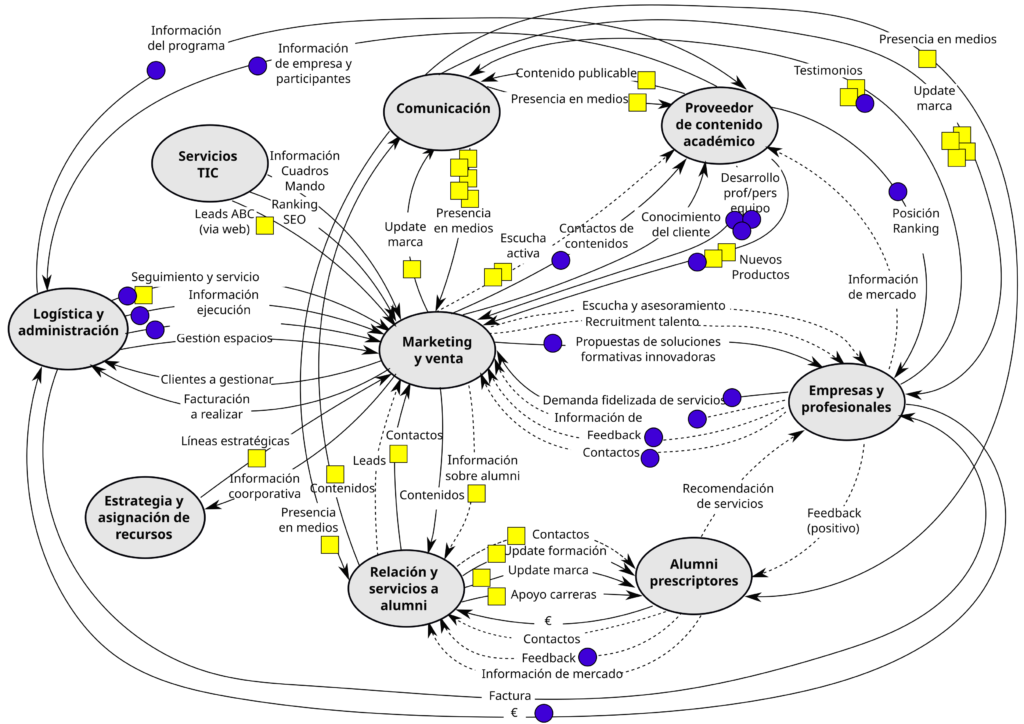
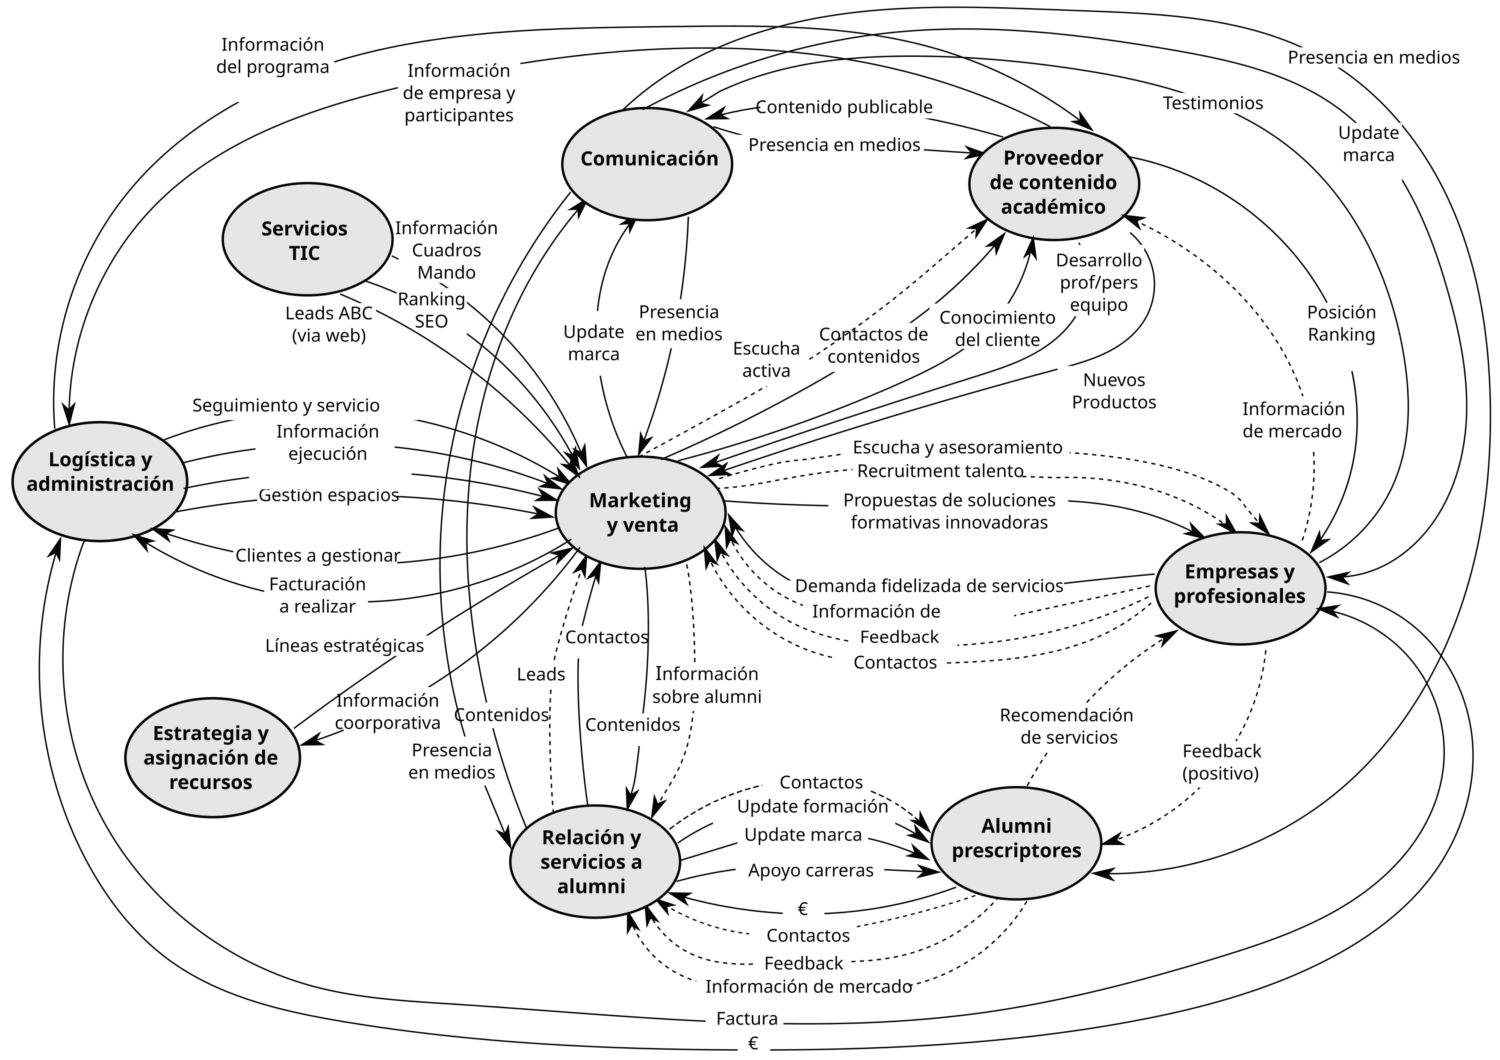
Here we show, as an example, Pantheon Work’s value network from a bird’s eye view:

This map allows us to visualize the three elements of a Value Network Analysis:
- Network nodes: the nodes of the value network are typically represented with an oval, and represent specific people who are contributing to the activity by playing a role in it. Of course, the same person can contribute from more than one role. In the case of Pantheon Work, there are collaborators who are also researchers or broadcasters, or organizational leaders who are also prescribers.
- Exchanges: each directional arrow is a value transaction between roles. Depending on the type of way in which the value delivery occurs, we draw the arrow either continuously or discontinuously. This takes us to the third and final element, the deliverables.
- Deliverable: the labels on the lines describe the specific way in which the value transaction takes place. We consider tangible deliverables to be those that are essential and expected/required by the roles to carry out the activity, and we draw them with a continuous line.
What are its main benefits?
When everyone involved in a network shares a vision of how value is being created and distributed, and what relationships and deliverables each role in the network needs, effective alignment and collaboration with an overall vision are achieved. From the point of view of the Pantheon Work model, it allows the twelve missions, which may naturally come into conflict, to establish their conversations in a common language (the value map) and with a common object (its optimization).
In many organizations, traditional business processes have been opened to Kaizen’s work, to work on continuous improvement, with teams from the different areas involved (i.e., they are no longer in the hands of experts who review and improve it once in a while, when the date for renewing a certification is approaching or when something is causing too much discomfort). To facilitate teamwork, the way of working processes has been opened visually on walls, with colored post-its, moving, grouping, recreating the process. For this, techniques such as Customer Journey or Agile Retrospectives are used. Our experience with Value Network Analysis is that it is an advantageous methodology for improvement, from the quality of intermediate or final deliverables to the dramatic reduction of delivery times or “time to market”.
But the Value Network Analysis goes beyond the Kaizen to enable the Kaikaku opportunity. Although Kaizen is a fairly common word, Kaikaku is a Japanese word that has not yet been widely used and is increasingly a key success factor. Kaizen is continuous, progressive improvement, based on the above, and Kaikaku is transformation, a creative, disruptive leap, where we throw away the old forms and open up to new ways of creating value. The digital age not only requires some organizations to perform a Kaikaku of their business model in order to survive, but it constantly provokes unforeseen ways, and only organizations with the ability to do Kaikakus can adapt and thrive in changing environments. We have facilitated Value Network Analysis sessions that have redefined business models, or in the case of non-profit foundations, their funding sources.
Because Value Network Analysis is a powerful tool for prospering in the digital age, we have adopted it as one of Pantheon Work’s key artifacts. It is a necessary tool but not enough, so once you have adopted it we suggest complementing it with the other practices in order to obtain a greater benefit.
How to make our first Value Network Analysis?
To draw the map of a value network we follow Verna Allee’s methodology, introduced in her book The Future of Knowledge and later developed in Value Networks and the True Nature of Collaboration. This methodology offers a very effective way of visualizing, analyzing and optimizing value creation in a network. Although it is an exercise that can reach a very high degree of sophistication, its fundamentals can be learned and operationalized relatively quickly. In this post, we will focus on the visualization of the value network, and we will give you some indications of how to start the analysis and optimization. We strongly advise you to buy Verna Allee’s great books, but in this post, we are going to explain the basics, which you can complement with this article that summarizes them. You can also listen to Verna Allee’s explanation in this video.
Step by step
1. Decide which participants to invite
Ideally, it is interesting to bring together a diverse group of people from your organization and your ecosystem, or at least people from the organization who know the stakeholders. It is best not to gather too large a group, but we have done exercises with groups of up to thirty people divided into two or three different groups and working in parallel.
2. Defining the scope of the analysis
The facilitator distributes post-its and markers to the participants, and together they clarify the perspective and scope of the map to be drawn. Depending on the objective of the analysis, we will choose to have a general vision, or a more specific one, for example, focusing on a type of service or on a particular department of the organization.
Once we have announced the scope of the analysis, the facilitator asks the participants to write it on the top of the large sheet of paper (we can cut a large piece of stripe paper or white paper, or tape a few sheets of flipchart paper), along with their names and the date.
3. Write the names of 10-15 people
 The facilitator asks the participants to write in post-its the names of the 10-15 people internal or external to the organization with whom they have been mostly related or who have been most decisive for them, within the scope of the map analysis (general, service, department, etc.) and in the last twelve months.The facilitator asks the participants to write in post-its the names of the 10-15 people internal or external to the organization with whom they have been mostly related or who have been most decisive for them, within the scope of the map analysis (general, service, department, etc.) and in the last twelve months.
4. Grouping in roles
 Participants group the post-its according to the role they have played (how they contribute) in the creation and exchange of value. If anyone has played more than one role, replicate the post-it. It is essential to be clear that the role it plays does not refer to its job description in the organization chart, nor a mission of the Pantheon Work model.
Verna Allee explains the meaning of this step in this way: “Changing the mentality to roles rather than positions opens up a world of possibilities. You can’t manage a network of value, you can only serve it through the roles you play. Of course, it can be the case that a person can appear in different roles, this appears in another fragment of Allee’s book: “I work in a small company and we all play multiple roles. Will this approach still work for us? This is actually an ideal approach for a small business because it helps people avoid the trap of organizing the business around key people rather than around roles that are key to business activities.
Ideally, we will group them into 8-10 roles. When mapping manually (without the assistance of any technology), it is difficult to handle more than 12 roles and 50 transactions.
5. Describe relationships and deliverables
 We will copy in post-its the names of the roles and we will distribute them in the big sheet where we are going to draw the map. The best thing is to put the central role of your analysis (your organization, your department, etc.) in the center, and the rest of the roles around, bringing closer those that we consider having a more significant number of transactions. The idea is that every relationship is a transaction of some kind. The next step is to describe the relationships and deliverables that exchange the roles we have defined, and draw an arrow between the roles where we can place them.
We include tangible and intangible deliverables that are exchanged roles. We call them “deliverables” because it can be verified that they are delivered or not, and we express them with names (not with verbs or adjectives).
For this first exercise, we propose you to simplify the notation of Verna Allee’s methodology, drawing a single line for all deliverables that move in one direction, and we distinguish two categories of deliverables:
- Tangible deliverables, in green color: the contractual, directly linked to the activity, those that are demandable between roles because so required by the contractual or normative relationship between them. Generally, they are those deliverables that contribute directly to the production and delivery of a product, service or financing. Therefore, an order, a report and an invoice are traditional examples of tangible deliverables.
- Intangible deliverables, in purple color: those that are delivered as a courtesy to build a fluid and robust relationship, but which are not in principle enforceable by the other. For example, exchange of favors, information, documents, power on decision-making, products, services, money, best practices, contacts, attention, advice, or any other deliverable that brings us some value, such as reputation, visibility, recognition, guidance, clarity, etc..
(Of course, you can use the traditional notation explained in the post What is a Value Network Analysis or draw later when you have collected all the elements. The original notation requires a bit of practice, but is more powerful at the cognitive level).
6. Indicate satisfaction with deliverables
 Participants evaluate with colored stickers the satisfaction of the roles with the deliverables they are receiving, in those that are most important. They can be used:
- blue sticker: the recipient is satisfied
- yellow sticker: the recipient is not satisfied.
Working groups are usually quite creative when working with a value map. Sometimes they may want to indicate satisfaction or dissatisfaction with more than one sticker, inconsistency in satisfaction by placing both a blue and yellow sticker, etc. In our opinion, it is worth being flexible with the methodology as long as the fundamentals are maintained: roles are roles, deliverables are effectively deliverables, and we clearly indicate in which direction they move.
7. Sequence transactions to validate the map
Sequencing consists of observing on the map the order in which transactions usually take place. This is not to reduce everything to a linear process, but to identify the multiple interdependencies between the roles. As Verna Allee says, “in process engineering, the goal is to determine a single optimal process and eliminate variation to obtain consistent results. With value network analysis it is objective to optimize multiple pathways and achieve consistent results while allowing for the variations needed for innovation, resilience, and network agility.
To facilitate sequencing, we ask the group about the first thing that happens in a typical scenario, and we follow the path. Then we can approach other beginnings, and other habitual ways.
Extra-ball: generating insights
We’ve already completed the map! In another post, we explain with an example of how we can analyze and optimize the flow of value in the network. As a foretaste, here are some trigger questions to debate about it that lead to compelling insights, which you can develop and make actionable with your preferred methodologies (design thinking, lean management, etc.):
- Who is more active on the net? Why?
- Who is less active in the network? Why?
- Who should appear and who doesn’t? Why?
- What relationships should be initiated? Strengthen? Take back?
- What opportunities do we have to expand or strengthen the network?
- Do all deliverables add value or do they generate another deliverable as a response?
- Is any exchange of deliverables weak or at risk?
- Does the network add value to all roles?
- Does anyone receive much more than they do?
In a future post, we will see the analysis of a specific case, that of the sale of training programs from the postgraduate school of a Spanish university to companies and professionals.